


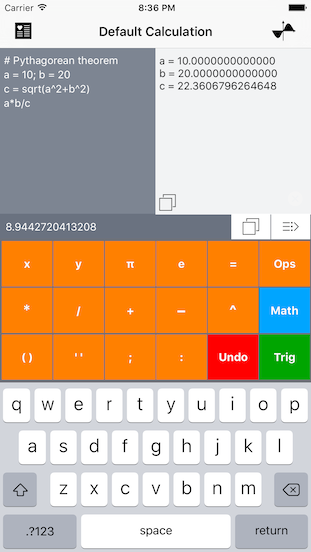
Math Graphing 2.0 is a powerful & unique 1D graphing calculator to plot simultaneously multiple mathematical expressions of arbitrary complexity using static and dynamic variables (including a time variable and random generation functions). It also includes a standard calculator mode that allows simultaneous evaluations of any number of intermediary variables. In partitcular, Math Graphing can help students improve their math skills by developing some visual intuition of mathematical expressions or advanced users who need some scientific capabilities only available with desktop software like Matlab or Mathematica.
A free Lite version with optional In-App Purchases is also available on the AppStore.
Math Graphing provides the following functionalities:
- Multiple expressions with quasi-unlimited number of variables can be combined to produce simple or complex formulas,
- Interactive sliders can be created to visually investigate the role of important parameters on the graphical representation of the formulas.
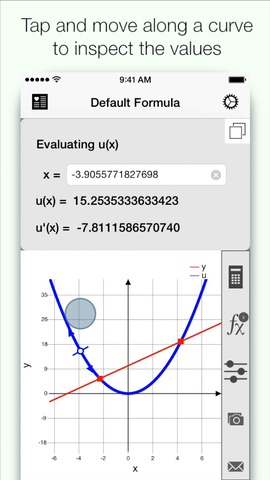
- Trace mode to display coordinates and derivative of marker on selected curve,
- Landscape mode for graphing,
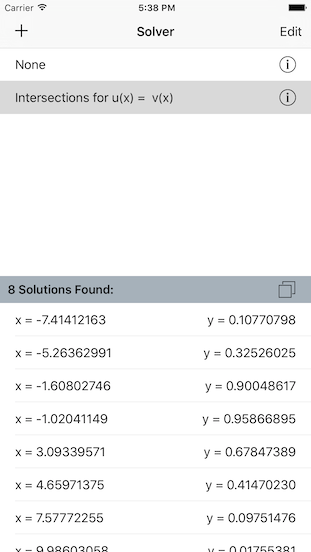
- Solver tool to solve y = f(x) where x or y are unknown, local/global minima/maxima/extrema, or functions intersection f(x) = g(x),
- Formula graphs can be saved to the device's Photos Album and the formulas can be exported through email with embedded graphs,
- Add any formula or calculation to your list of favorites,
- Several formulas can be plotted simultaneously in different colors and styles,
- Customizable graph appearance: axes labels and ranges, title, curve color and style, ticks number, grid, legends, etc,
- Single-precision calculator supporting multiple variables.
SCREENSHOTS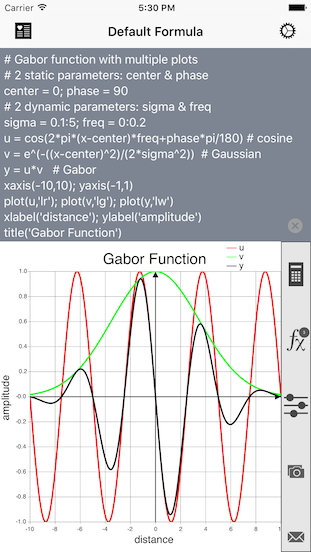


Here are tips to get you started:
- To modify the formula, simply touch its mathematical expression to edit it: both standard and custom keyboards are available to provide maximum flexibility. Both syntactic and evaluation errors are reported continuously.
- To visualize the modified formula, press the round "Update" button. The graphical representation supports portrait and landscape modes.
- Use standard touch gestures to manipulate the graph: pinch to zoom, drag to move the graph, pinch below the x-axis or on the left of y-axis to zoom along the x and y axes only,
- Tap the slider tool in the right toolbar to access the interactive sliders. Tap once on the graph to return to the gesture mode.
- Tap and hold to select the closest curve to access the trace mode, and move your finger along the x-axis to shift the marker on the curve and display its coordinates and derivative above the graph.
- Press the "Settings" button to access the Settings and Help sections: Settings allow the customization of the graphing properties and the size of emailed images. The Help section provides a description of all available mathematical operators and functions.
- To export a graph to your Photos Album or email the formula, simply tap on one of the export tools in the right toolbar. Exported images to the photo album may contain an inset with the formula, and current or favorite formulas can be emailed.
- To manage your formula favorites, press the "Favorites" button: then, to create a new empty formula, press the '+' button; to duplicate a formula, select its name and provide a new name; to remove, rename, or reorder any favorite formula, press the "Edit" button.
- To return to the edit mode or visualize any favorite formula or calculation, press its disclosure button.
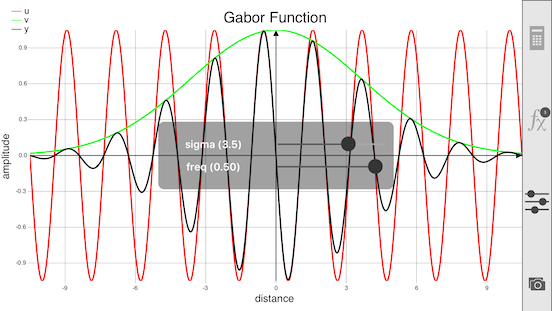
Example:
# Gabor function with multiple plots
# 2 static parameters: center & phase
center = 0; phase = 90
# 2 dynamic parameters: sigma & freq
sigma = 1:50; freq = 0:0.2
u = cos(2*pi*(x-50)*freq+phase*pi/180)
v = e^(-((x-center)^2)/(2*sigma^2))
y = u*v
plot(u,'lr'); plot(v,'lg'); plot(y,'lw')
xlabel('distance'); ylabel('amplitude')
title('Gabor Function')
SHORT TUTORIAL ON CREATING FORMULAS
With "Math Graphing", formulas of any complexity can be plotted as function of any variable or parameter. A formula typically consists in expressing the value of a variable y as function of another variable x. For example:
y = f(x)
A formula can also consist of several expressions separated by a semicolon delimiter on the same line or split across several lines. For example, to compute y as function of x through the use of intermediary variables u and v:
u = g(x); v = h(u)
y = f(v)
The formula y = f(x) can be plotted by using the plot command:
plot(x,y)
x being the default continuous variable used to plot any other variable along the x-axis of the graph, the formula can be also plotted by simply entering:
plot(y)
However, it is also possible to specify a variable as a discrete range with starting, step and ending values (variable = starting value : step : ending value). For example, to plot a cosine function as function of the discrete variable t between 0 and 100 by step of 5:
t = 0:5:100
y = cos(2*pi*t/20)
plot(t,y)
To customize the appearance of a plot, add tags between apostrophes. For example, to plot y = f(x) as red empty circle symbols:
plot(t,y,'srec')
The tag may consist of 4 letters: the 1st letter for the curve appearance ('l' for line, 's' for symbols, 'b' for bars), the 2nd letter for the curve color ('w' for white, 'r' for red, 'g' for green, 'b' for blue), the 3rd letter for the symbols or bars appearance ('e' for empty, 'f' for filled), the 4th letter for the symbols shape ('c' for circle, 's' for square).
In addition of variables, it is also possible to specify parameters that affect how the formula depends on variables. For example:
wavelength = 20
t = 0:1:100
y = cos(2*pi*t/wavelength)
plot(t,y,'l')
To visualize the effect of such parameters on the plotted formula, the parameter value can be controlled through an interactive slider by specifying a range with starting and ending values (parameter = starting value : ending value). For example, to create a slider that controls the parameter wavelength between 1 and 50, simply use:
wavelength = 1:50
To visualize the effect of the parameter on the formula, double tap the graph to access the interactive slider, and change its value. The graphical representation of the formula is then automatically updated with the new parameter value when releasing the slider.
RELEASE HISTORY
Version 2.0.1 (Dec 20, 2016):
- add a title and values of dynamic variables to tabulated data copied from the solver module
- addition of gamma, factorial, binomial, error, Student's t-distribution pdf, and Chi-Square Distribution cdf functions
- shake the device to reset the axes with a 1:1 aspect ratio
- minor bug fixes in interface orientation change
Version 2.0 (Dec 10, 2016):
- complete redesign
- support for iOS 8, 9 and 10
- iOS 10 compliant interface
- support for iPhone 5 to 7S screen size
- improved reporting and continuous checking of syntax & evaluation errors
- support for undo
- option for text size for formula and calculation
- optional iCloud backup of calculations and formulas
- axes range specification (through axis() & yaxis() commands)
- option for originated axes
- movable legend for plotted curves and related option
- separate tick numbers for x- and y-axes to allow rectangular grid
- more robust graphing with infinite or undefined evaluation
- better determination of axis tick values based on range and number of ticks
- export to table (through “None” Solver option)
- addition of randn(), length(), std(), round(), J0, J1 and Jn Bessel functions
- support for 'time' variable in formula
- improve display of touched data point on graph (through inspector with copy option and under sliders control)
- 1024 x 1024 export option
- tip notifications
- more reliable and precise solvers
- addition of intersection solver
- report number of solver solutions found and list them in a copyable table
- list management for calculations
- disclosure of each calculation variable.
Version 1.3 (May 5, 2010):
- Addition of a right toolbar to access a single-precision calculator, a solver tool, the interactive sliders and the export functions,
- Report of derivative in trace mode (with marker with tangent arrow),
- Support for independent zooming along the x and y axes (pinch below the x-axis or on the left of y-axis),
- Addition of min(), max(), mean(), sum(), norm() vector functions,
- Fix title position being too close to the graph top,
- Redesign of custom keyboards.
Version 1.2 (Oct 31, 2009):
- Addition of a trace mode (tap and hold to select the closest curve, and move your finger along the x-axis to shift the marker on the curve and display its coordinates above the graph),
- Addition of xlabel, ylabel, and title commands to customize further the graph appearance,
- Fix problem of axes range being reset when e-mailing graph,
- Improvement of small previews appearance in Favorites.
Version 1.1 (Sept 11, 2009):
- Support for in-application email capability under iPhone 3.0,
- Addition of nb ticks settings,
- Addition of optional grid setting,
- Addition for choice of linear or log scale setting,
- Improved legibility for axis labels.
Version 1.0 (July 14, 2009):
- First released version on AppStore.